

Have you ever want to do more with weather data in your Excel workbooks? In this blog entry we are going to consider the tasks of a construction site manager and we want to use our Multi-Site Forecast Workbook where we can easily monitor the weather at a large number of sites to evaluate many different weather variables for different job tasks. Here are a few common scenarios:
- It is below 32 degrees at 10 locations so concrete cannot be poured at those sites.
- Wind gusts are going to exceed 50 mph so extra precautions with high-rise or crane work must be adhered to .
- Rain is going to exceed two inches in a short time period so grading work will be unsafe and extra measures must be taken to stabilize completed grading work.
- Excessive cold or heat may impact workers or machinery.
This workbook would need to cover several different functional areas in order to make it a successful daily workbook. Here is our list:
- Automatically query for live 15-day forecasts of various weather conditions from an accurate weather source.
- Return weather data for dozens of weather locations anywhere in the world.
- Set weather condition alerts and show which locations have potential issues.
- Easily see forecast calendars for all sites by either daily or detailed hourly data to see specific hourly windows where tasks may be interrupted.
Once we are able to accomplish these goals, we will make our operation better prepared for weather conditions which will translate to a more efficient and safer workplace.
In this blog we are discussing the Multi-Site Forecast Workbook, how you can download, use and modify it. We will discuss some Excel techniques as well as touch on the PowerQuery and PivotTable features that make this possible. In other blogs and tech notes we will feature specific technical solutions and how you can implement them. Let’s get started.
Weather Workbook Series
If you have followed our Weather Workbooks in the past, you may be familiar with several different varieties of workbooks. In the past we have show customized versions that are mostly branded for the task at hand such as Construction, Shipping and more. At the core of all these workbooks is the basic ability to use Excel and its Power Query feature found through Data->FromWeb URL queries and return the data in a calendar-style format that allows users to look at forecasts for many locations in a single glance. Here is a link to our core Multi-site Forecast Workbook as well as a tutorial that describes how you can create your own Parameterized Excel Power Query workbook.
How Can I Get This Weather Workbook?
DOWNLOAD THE MULTISITE FORECAST WORKBOOK
Other weather workbooks are available on the GitHub: Weather Workbooks on GitHub
You will also need to have an API Key to send with the query so the server can authenticate your request as being from a registered user. Trial accounts and some paid accounts will provide you with API Key access. To sign up for an account, please follow the steps in this technote: How to Sign up for an API Account
NOTE: The number of sites/locations that you can query is limited by your plan. For trial purposes you can see up to two sites, but you can easily track thousands at the same time with a more advanced license
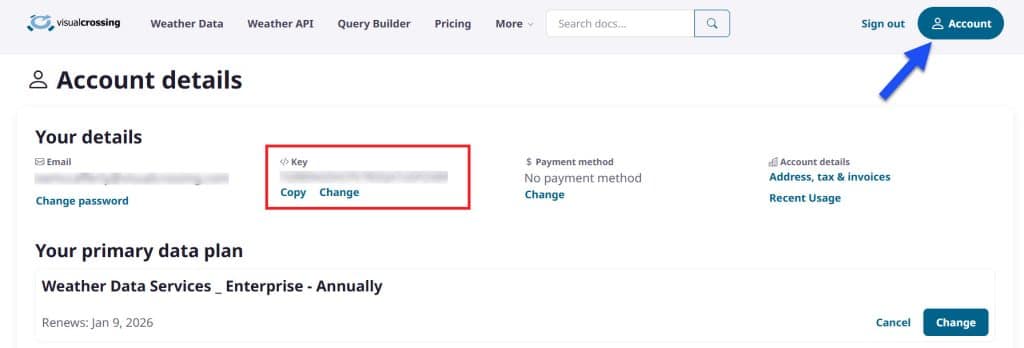
Once you have an account, just click on the “Account” button after signing in and copy the API Key. You will paste this key into the Weather Workbooks setup page to let the workbook pass your key in for all queries.
A Tour of the Forecast Weather Workbook
There are many sheets on the workbook and we will define them here so that you are aware of their uses. Note that some of them may be hidden and may be optionally shown by the user.

- Forecast Settings – This is the main user control panel for the workbook. Here you set the locations, set conditions thresholds, enter your API key and monitor alerts for locations.
- Daily Forecast Calendar – This is a list of locations in calendar form for the next 15 days. It will show all forecast conditions and color highlight those that are outside of the set values.
- Hourly Forecast Calendar – This is similar to the Forecast Calendar but shows hourly data instead of daily aggregations.
- RAW DAILY FORECAST DATA (hidden) – This is the raw table of daily forecast result and is only required for debugging purposes.
- RAW HOURLY FORECAST DATA (hidden) – This is the raw table of hourly forecast results and is only required for debugging purposes.
- Admin Settings (hidden) – This sheet is where the strings that build the query are constructed for submission to the weather server. Only if you are customizing the worksheet should you ever need this page. Technical Support may ask occasionally for you to send them the final query string for debug purposes. the “URLCOPY” sections are particularly useful as you can simply Copy-Paste the cell values into a web browser bar to test the query and get results back.
This Workbook was designed for the following use case: A construction manager can easily enter in many construction sites, set weather alert values that they would like to be alerted on for all of their locations. Then find more details about which days and hours are triggering those alerts so that they can take appropriate action. They can also use the calendar functions to plan tasks for up to two weeks ahead.
Forecast Settings
The main forecast settings page of the Construction Workbook is the Forecast Settings sheet. Here we can do the following tasks
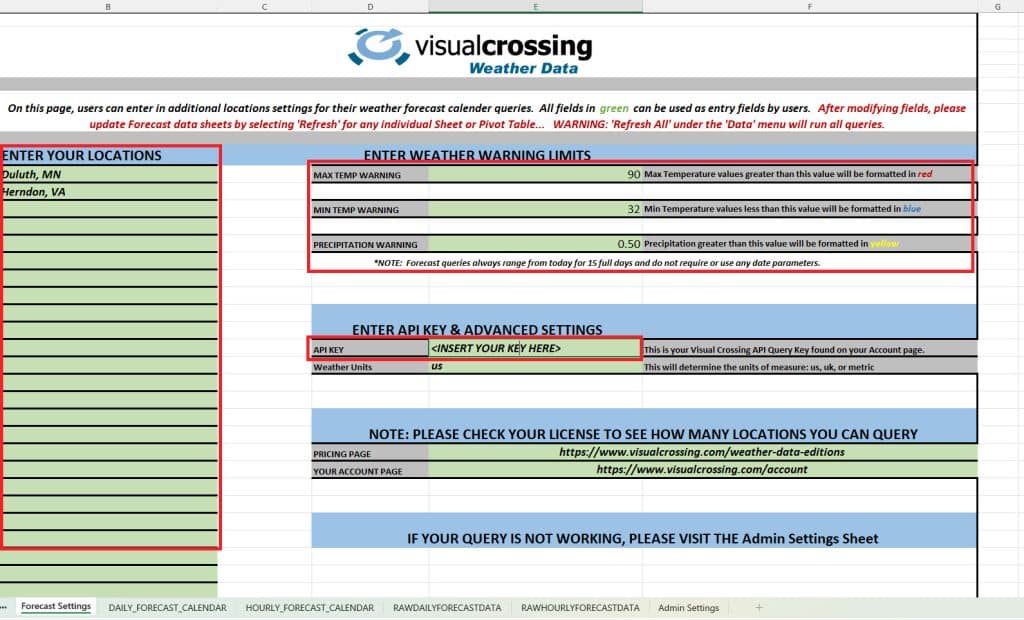
- Add API Key – All of the Weather Workbooks use the Visual Crossing Weather Data Server and require that you have an API Key. See the section above on how to acquire and copy yours from your account. Simply paste your API Key into the green shaded area labeled API Key and is pre-filled with <INSERT YOUR KEY HERE>.
- Enter in Locations – Being able to monitor your many locations in a single view is critical to managing sites. In the green list area labeled “Enter Your Locations” you can enter in your location strings. Anything from full addresses, zip code, cities, counties or lat/lon values are acceptable. This green area is a special section found in the Excel ‘Name Manager’ and named ‘MYLOCATIONSTABLE’ . It is 1000 rows by default but can be expanded to suit your needs. Be careful to do this properly and use the Name Manager to assist you to make sure that the name represents the area of cells that you expect.
- Enter Weather Warning Limits – Scanning weather forecasts for dozens of construction sties is error-prone and inefficient, one the key goals of the Construction Workbook is to allow managers to set their own values that they wish to be alerted on. We have included several conditions here but the workbook can be modified for other conditions as well. Simply enter in your maximum (minimum for min temp) values and the Pivot Table based calendars will color-highlight the threshold values that exceed your limits. These limits are set using Excel’s ‘Conditional Formatting’ editor found on the Home Menu. For best results follow the rules that are already defined for you for current values.
Forecast Calendar
The Forecast Calendar sheet is a PivotTable that takes the results of a PowerQuery to the Visual Crossing Weather Service. The table is pivoted such that dates are along the columns and all weather variables for every location are listed in the rows.
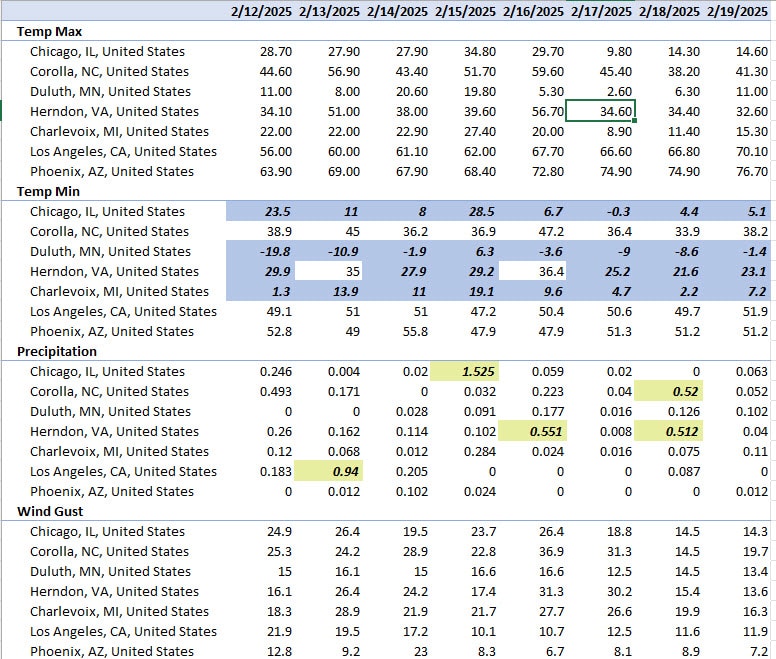
In addition to the forecast calendar view you will notice that this table utilizes Excel’s Conditional Formatting feature to highlight our conditions when they exceed condition alert values. Managers can easily weeks at a glance for dozens of locations and where areas of concern will be.
Hourly Calendar
Many times it is not good enough to know if a day’s high or low values exceed limitations but rather construction managers need to be able to schedule windows in the day where conditions are right. It also allows for a more granular level of efficiency through the day by allowing weather-related tasks to be “squeezed” into a schedule. The Hourly Calendar is another PivotTable derived from a PowerQuery using the Visual Crossing server to pull hourly forecast data.
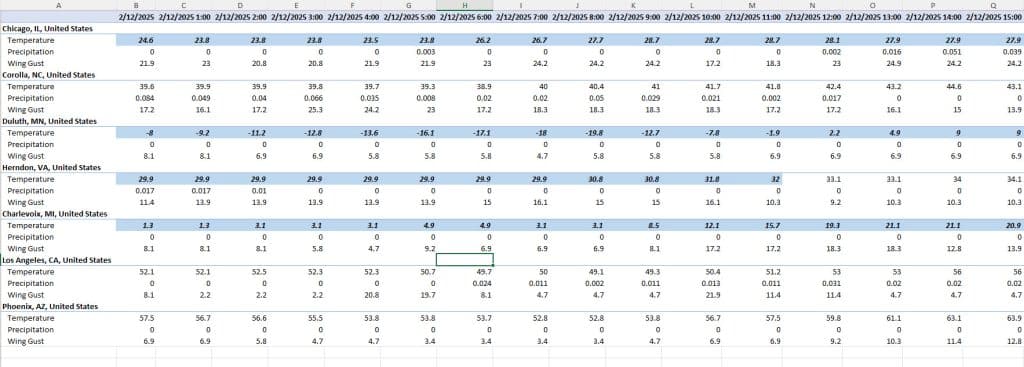
Note that here the Visual Crossing server is giving us temp rather than mintemp and maxtemp found in the Forecast Calendar. There is no minimum and maximum for the hour… just a temperature value, but we will still have two alerts for max/min but they apply to the same temp value. Again, through conditional formatting we can see how many hours during the day, cold/heat/precip will last. This gives us a finer grain control over our tasks.
All Done!
As you can see the Forecast Weather Workbook shows the amazing capabilities of Excel and the Visual Crossing Weather Service work together. Being able to retrieve data in CSV format for multiple locations in a single query gives us the capability to query for a single table of data that gives us everything we need to load weather data directly into Excel and do powerful, time-saving exercises with it. The Forecast Workbook is just one example but it can be used out-of-the-box or modified by users to meet their specific needs. If you need help, please reach out to our Support Team.