

One this page you will find a list of our free weather tools and dashboards. These are all accessible without cost and typically without even needing to sign up for a Visual Crossing Weather account. (Of course, we highly recommend that you do sign up as some features are only accessible when logged into our site.) They are ideal sources of historical weather and forecast data, climate averages, energy costs, gardening information.
Read below to find the right dashboard to solve your weather data needs.
Weather Calendar
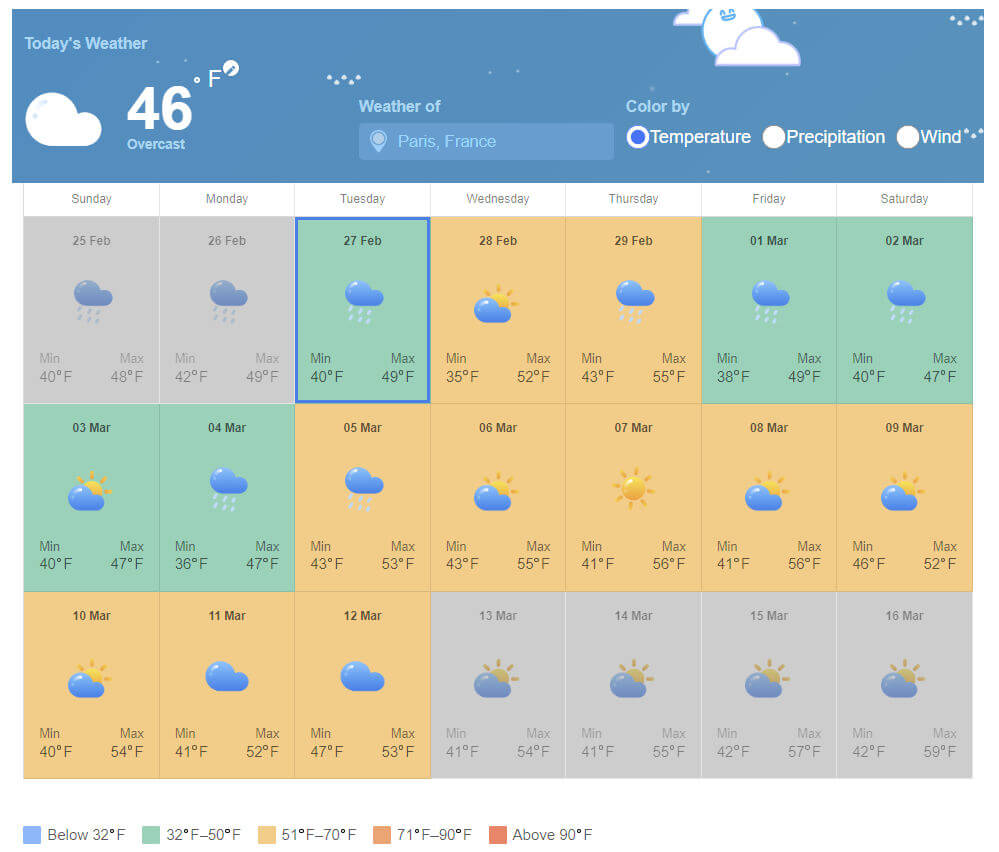
The Weather Calendar provides an overview of the forecast in a calendar format to aid in planning and the understanding of upcoming conditions. It’s interactive color thresholding makes it easy to see at a glance how days will be affected by temperature, precipitation, and wind. The “bookend” areas in gray represent days outside of the traditional 15-day model-based forecast. For days before the current day, history data is shown while for days after the 15-day forecast, statistical forecasts are used. This shows the power of the Visual Crossing Timeline API to deliver weather data from a range of sources in response to a single query.
If you like this calendar functionality but would like to tweak it to fit your use case, you are in luck! The Weather Calendar was designed to be used as a starting point for your own customization work. It is implemented as a standalone widget that can be easily dropped into your own website. You can find the code and more details on GitHub.
Weather History
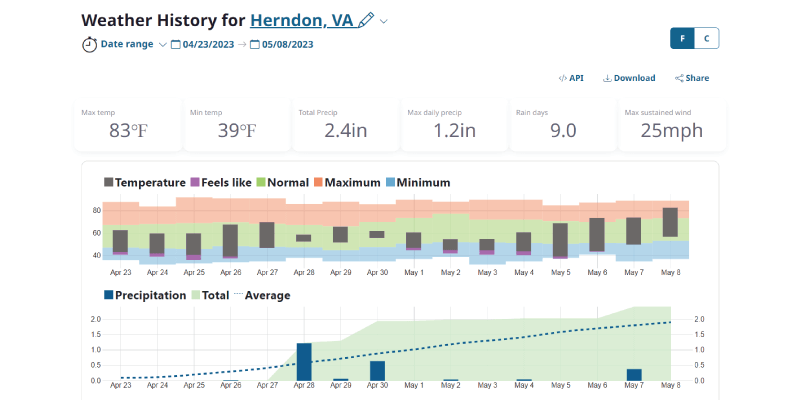
The Weather History Dashboard provides a summary of the historical weather conditions for any given location and date range. Simply enter the location of interest, either as a full address or a lat/lon pair, along with any date or date range back to January 1970.
In addition to the weather conditions for the period requested, the Weather History Dashboard also shows a map of the weather stations available near the location during the time period requested. This allows you to explore the stations that are available and find their IDs for later analysis.
Weather Forecast
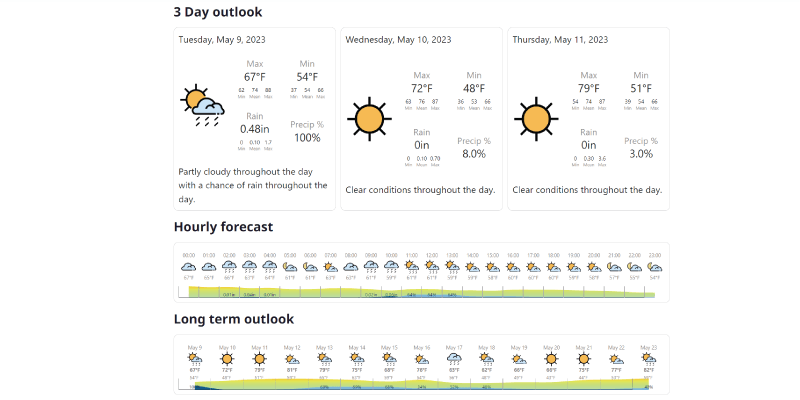
The Weather Forecast Dashboard provides current conditions, 3-day forecasts, and extended forecasts for any location. Our Weather Engine automatically merges the best available weather forecast models to create an accurate weather forecast for any location on the globe.
Query Builder
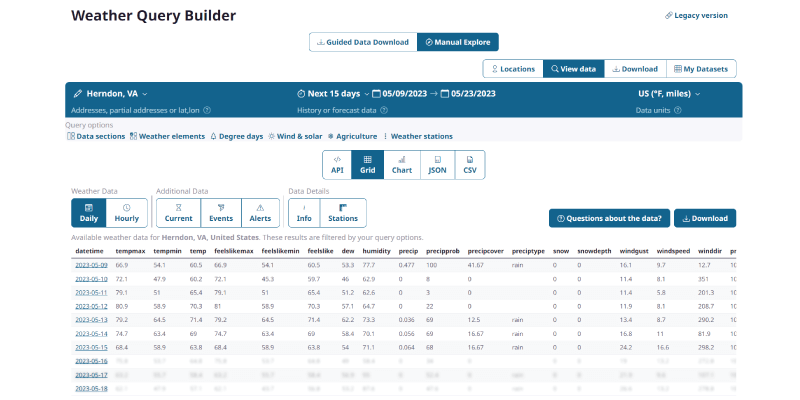
The Visual Crossing Query Builder tool enables the full power of the Visual Crossing Weather API to be used in a convenient web-based interface. With it, you can create custom weather queries including historical data searches, forecasts, and ultra-long range forecasts based on climate normals. You have full control over which weather stations are searched, which weather sources are considered, and which weather elements are returned. You can then review the result data on an interactive grid, download the data for further analysis, or ask the interface to create a query URL that can be used to replicate your exact query inside any code, script, or analysis tool. You can even schedule your query so that the data is refreshed automatically at a specific time of day.
The best part is that most of Query Builder’s functionality is completely free and a large part is available even without signing up for an account.
Average Weather
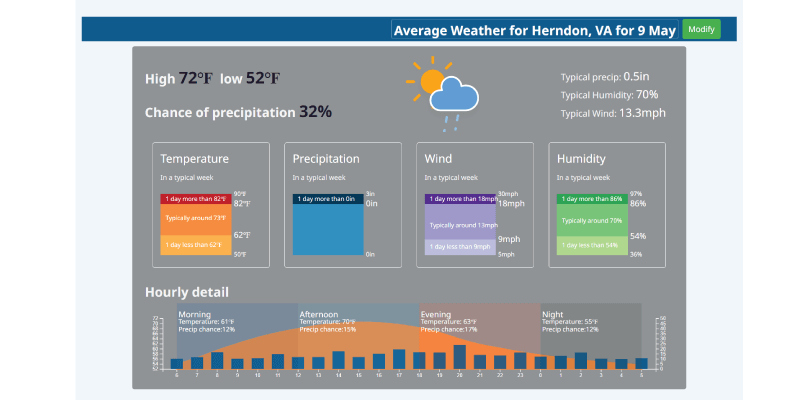
The Average Weather Dashboard provides weather patterns for any day of the year based on climate normals and extremes calculated across decades of historical weather data. This data can help you make plans far into the future for dates when traditional model-based 15-day forecasts are not yet available.
Winter Energy Calculator
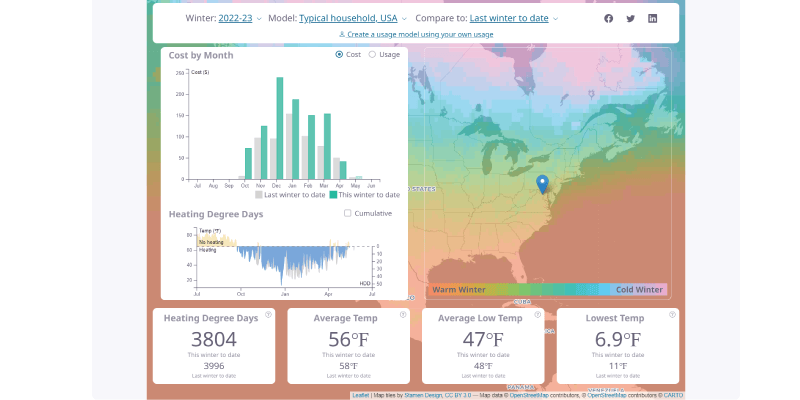
Visual Crossing’s Winter Energy Calculator shows how winter temperatures and rising energy costs affect heating energy usage and costs around the world. It combines key elements such as heating degree days, home energy usage profiles, and regional energy costs to continuously update energy usage and heating bill estimates throughout the season.
How Hot / Cold is it?
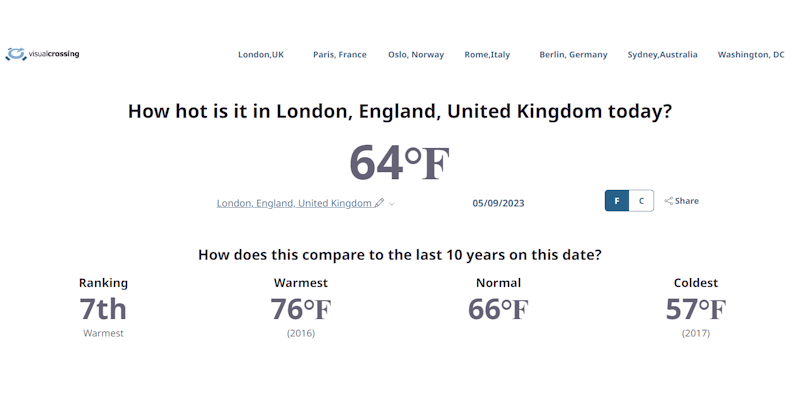
These simple dashboards provide a quick indicator of the maximum and minimum temperatures today and compare them to long-term records.
Frost Dates
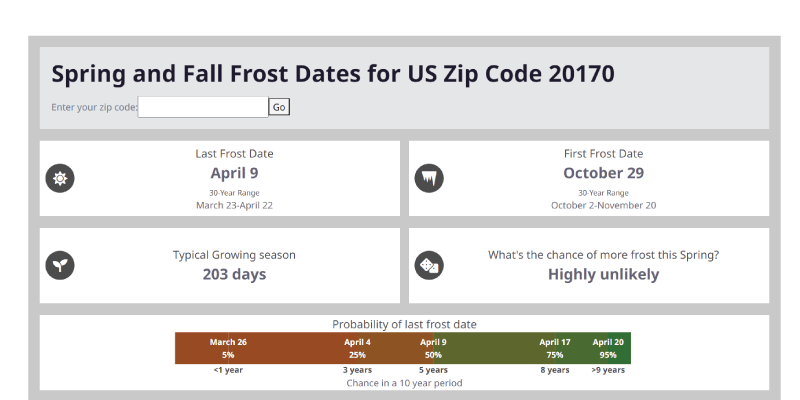
For gardeners and outdoor lovers who need to know when to expect the first and last frost of the season, the Frost Dates Dashboard provides the most recent first and last frost date as well as the recent average frost ranges for any location.
Next Weekend / Last Weekend
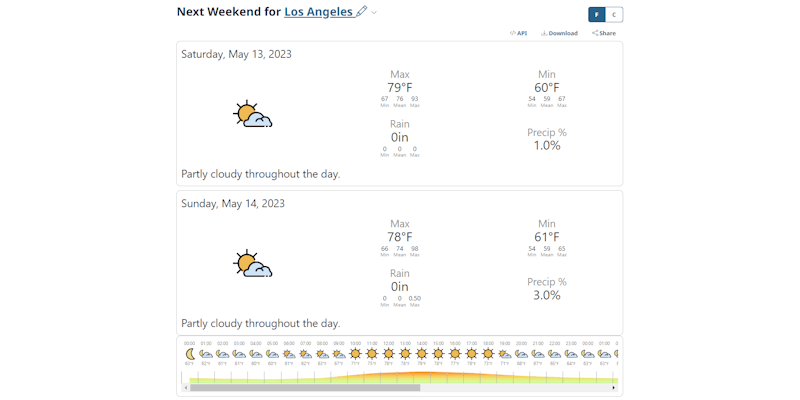
These dashboard provide a quick and easy way to determine weekend weather. As the names imply, the Next Weekend Dashboard shows the forecast conditions for the upcoming weekend while the Last Weekend Dashboard shows the historical conditions that happened during the most recent weekend past.
Yesterday / Today / Tomorrow
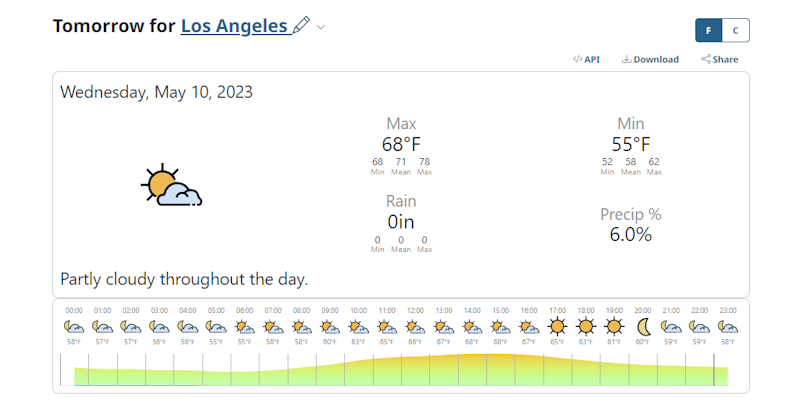
These dashboard provide a simple way to get a visual snapshot of yesterday‘s historical weather reports, today‘s current conditions, and tomorrow‘s forecast respectively.
Climate Change
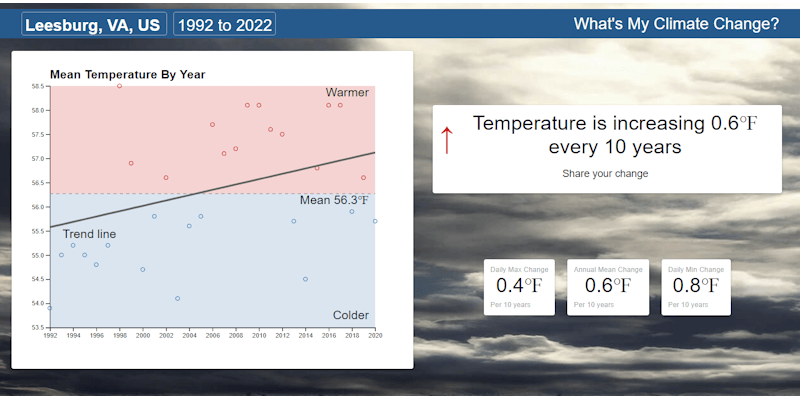
If you want to know how the climate is changing in any global location over the past decades, then the Climate Change Dashboard has your answer. Simply pick your location and the number of years that you wish to consider. The Dashboard will graphically show you how the temperature has changed right in your own backyard.
Event Planner
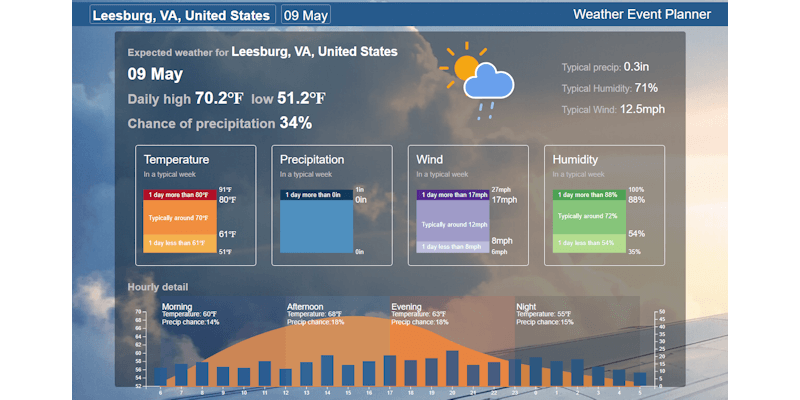
The Event Planner Dashboard aggregates historical weather reports to calculate the expected weather conditions and the extremes for any global location and any day of the year. It identifies these climate patterns by aggregating decades of historical weather observations both on your specific date and temporally nearby dates with similar weather patterns. This tool can be used to make plans for future events that fall outside the standard, 15-day computer model-based forecast.