

We’re excited to announce the new Weather Statistics package, designed to help users quickly and easily perform statistical analysis on any hourly or daily weather dataset. With this powerful tool, you can:
- Generate climate and historical summaries
- Analyze large datasets to identify outliers and key events
- Calculate specialized metrics such as frost dates and more
Now in Preview: Weather Statistics is currently available as a preview feature. During this period, it is included at no additional cost for all monthly and annual subscription plans—including Professional, Corporate, and Enterprise tiers.
Please note that the feature will evolve as we continue testing and incorporating feedback from users. We look forward to your input as we refine this powerful new capability.
Dataset record costs
Weather Statistics packages use your plan’s data record allocation based on the underlying daily or hourly weather data required to create the analysis. For example, running a statistical summary for 10 years of daily data will consume approximately 365 x 10 = 3,650 records.
This usage will be counted against your daily or monthly record limits according to your plan.
Basic Architecture of a Weather Statistics and Analysis Dataset
Although each dataset may provide different outputs and support varied use cases, the overall workflow follows a consistent pattern:
- Creation of a Timeline Weather Dataset
- Configuration of Statistical Package Type and Options
- Execution and Download of the Results
Creation of a Timeline Weather Dataset
Each Weather Statistics dataset begins with the generation of a base daily or hourly weather dataset, created using the Weather Query Builder. You can fully customize the dataset with all standard features:
- Select specific weather stations or model sources
- Enable radar-based precipitation enhancement
- Include advanced elements such as:
- Degree Days (heating/cooling)
- Air Quality Data
- Agricultural or Energy-specific fields
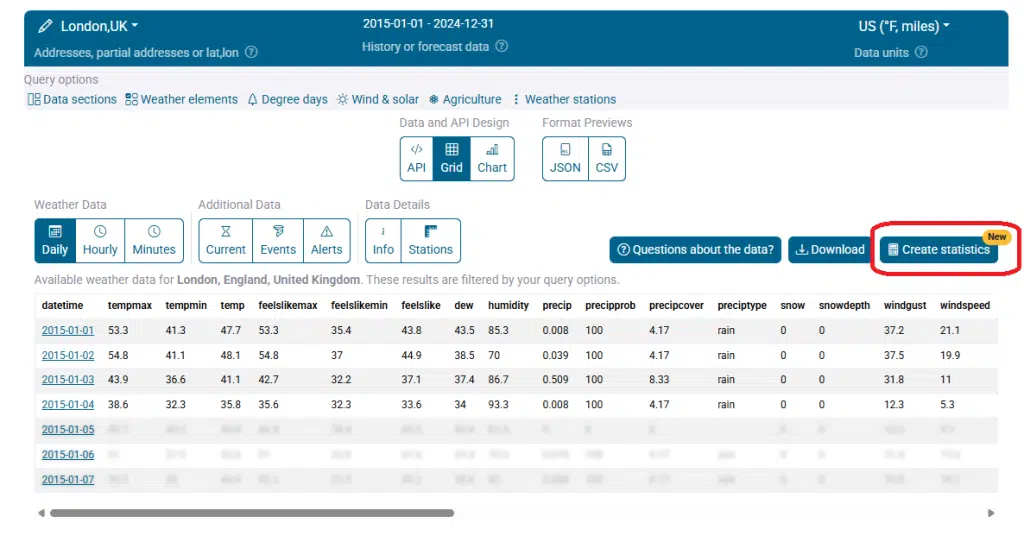
Tip: Weather Statistics works best with multi-year datasets, as it is designed for long-term trend analysis and for filtering large datasets to highlight key outliers or significant values.
Once your base dataset is defined, click the “Create statistics” button to choose your desired package type.
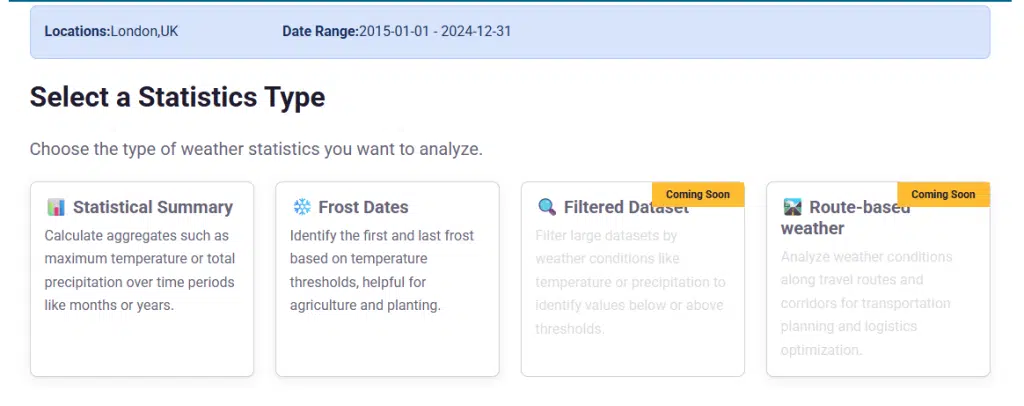
Configuration of Statistical Package Type and Options
After selecting a package type (e.g., climate summary, frost dates), you can configure the analysis in more detail. Each package provides different configuration options depending on its purpose.
- Period grouping: Annual, Monthly, Weekly, or Daily summaries
- Statistical measures: Means, percentiles, extremes, anomalies
- Breakout options: Group results by year, by condition thresholds, or other filters
We will continue adding more package types based on feedback. If there’s a particular analysis you’d like to see, please let us know.
Execution and Download of the Results
Once configured, submit the package for execution. This works like any standard dataset query in the Weather Query Builder.
After processing:
- The results will appear in your ‘My Datasets’ list
- You can view, download, and further explore the output in CSV or JSON depending on your needs
This process allows users to easily convert hourly and daily raw weather data into useful summaries, helping uncover long-term climate patterns, seasonal behaviors, and important outliers in large weather datasets.
How to create Weather Statistics and Analysis Packages
Statistical Summaries
Statistical Summaries let you quickly calculate long-term historical values such as average rainfall, typical highs and lows, and similar metrics for any weather element.
Steps to create a Statistical Summary:
- Create a multiple year historical dataset for the location and time period of interest.
- Choose ‘Statistical Summary’ for the package type
- Configure the statistical options
- Submit the statistical summary dataset for creation.
Statistical Summary Configuration
Once you have chosen ‘Statistical Summaries’ as your output package type, you can then configure the options. The three main options to select are:
- The statistical features to calculate for each element (such as maximum, minimum, mean, or sum)
- The period for which you want climate statistics
- The weather elements you want statistics for
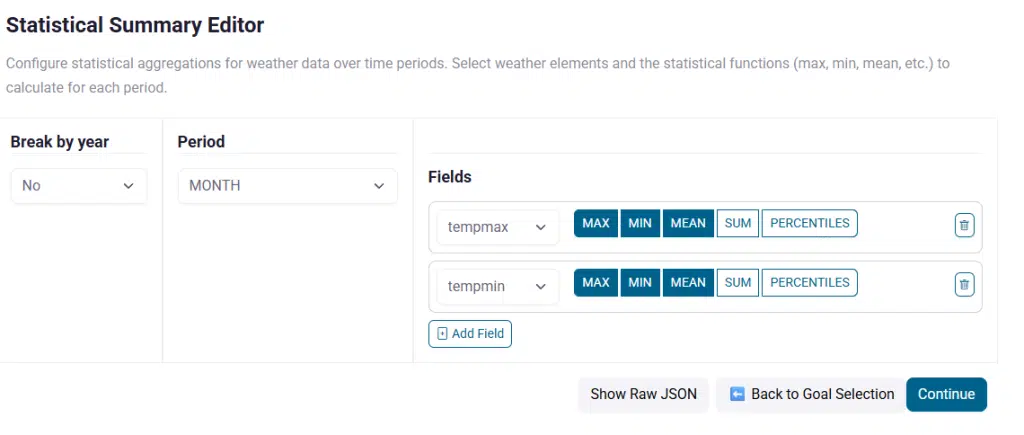
Period and break by year
The period defines the calendar interval for which you want to generate statistics. For example, if you want to create a report on “What is the normal weather by month for London, England,” you could choose ‘Month’ as your period. If you also wish to break out individual years (e.g., “What was the mean temperature for London, England in January 2022 vs. January 2023”), you would indicate that the results should be broken out by year.
Fields
The list of fields defines which weather elements you want to include in the statistics. In this case, we want to calculate the maximum, minimum, and mean for both daily maximum temperature and daily minimum temperature.
Frost Dates
Frost dates provides a straightforward way to identify when the the last frost will be in the Spring and the first frost will be in the Autumn or Fall. This is important for planning in agriculture and is also of great interest to gardeners and horticulturists.
To create a frost date analysis
- Create a multiple year historical dataset for the location and time period of interest.
- Choose ‘Frost Dates’ for the package type
- Configure the Frost Date options
- Submit the Frost Dates dataset for creation.
Frost Date Configuration
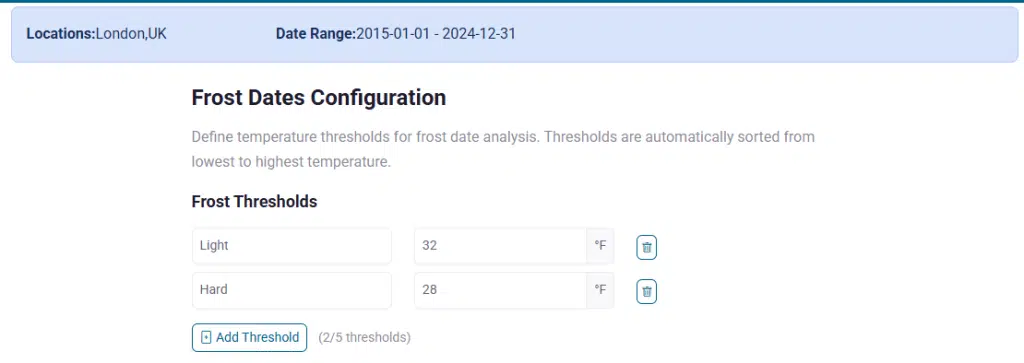
Frost dates includes the options to generate the statistics for multiple levels of Frost. For example, it’s common to track light frosts, where the temperature just falls to freezing but may not be cold or sustained enough to kill plants versus colder temperatures where frost-sensitive plants will almost certainly be impacted.
Once you have chose the frost levels that you are interested in, you can submit the dataset for execution and pick up the results in the My datasets section of the interface.
Questions or need help?
If you have a question or need help, please post on our actively monitored forum for the fastest replies. You can also contact our Support Team.