

Weather Data for Solar Energy
Available solar weather elements

Global Horizontal Irradiance (GHI)

Direct Normal Irradiance (DNI)

Diffuse Normal Irradiance (DIF)

Global Tilt Irradiance (GTI)

Sun Elevation

Sun Azimuth
Solve your business weather data challenges

Site Planning
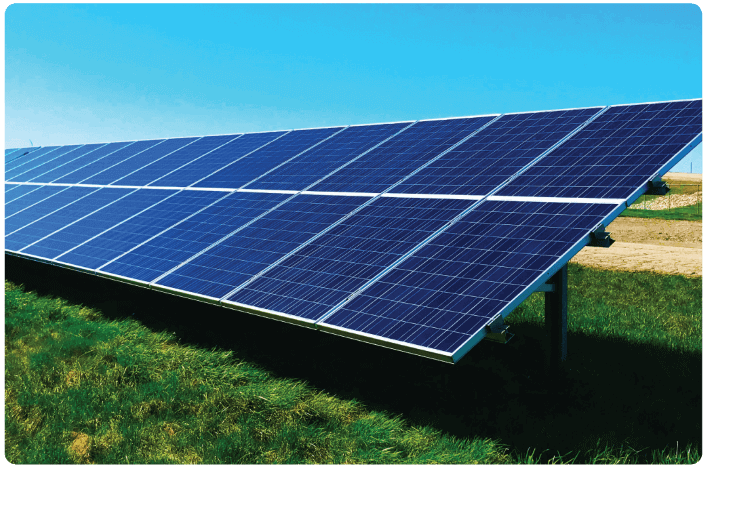
Historical weather data is the key resource for predicting how a specific solar energy site and system placement will perform over time. While historical solar energy data will help you simulate the amount of raw energy that is available at a location throughout the year, general historical weather data will also help you estimate the cost of ongoing maintenance and exposure to catastrophic risks. Access to this data allows you to answer important questions regarding temperature variability that can affect photovoltaic production, the likelihood of damaging storms, and even air quality information that can help you plan cleaning schedules and repair costs.
In order to support advanced photovoltaic power simulation models, Visual Crossing’s energy elements provide not only the Global Horizontal Irradiance (GHI), but also Direct Normal Irradiance (DNI), Diffuse Normal Irradiance (DIF) and Global Tilted Irradiance (GTI). Whether you are using a commercial planning tools such as Aurora, Helioscope or Scanfly, or your own homegrown applications, you will have instant access to the solar measures that you need to streamline your project from concept, to site selection, to approval.
Construction & Installation
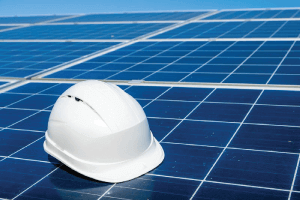
Accurate weather data is essential to managing any construction project efficiently so that it can finish on time and on budget. While temperatures may not affect the installation of photovoltaic panels themselves, cold may, for example, delay concrete pouring needed for their mounts. Accurate weather data is essential to managing any construction project efficiently so that it can finish on time and on budget. While temperatures may not affect the installation of photovoltaic panels themselves, cold may, for example, delay concrete pouring needed for their mounts. Likewise windy, icy, or rainy conditions may delay workers on roofs or electricians wiring external panels. Also, historical wind and rain data help to ensure panel mounting configurations that are less susceptible to vibrations and other damaging conditions.
In most ways solar energy construction sites have the same requirements as other similar types of construction either residential or commercial. Many construction projects already use Visual Crossing Weather data, and we have created the Construction Weather Management Workbook for Microsoft Excel to make using weather data in construction even easier. This free resource enables construction managers to schedule and adjust tasks based on key weather conditions and forecast triggers such as temperature, wind, and rain.
Production Operations
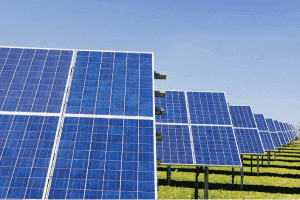
Ongoing weather data and forecasts are key to keeping a solar energy installation running at peak production. Live current conditions data help you to monitor output minute by minute and hour by hour to ensure that the energy produced matches the expectation. With this data you can easily account for the current solar radiation conditions including cloud cover, solar incidence, and more. Matching predicted data to actual energy output helps instill confidence that the systems are working optimally while even minor mismatches can be a valuable early warning sign of trouble.
Residential panels are typically installed at a fixed angle set in the planning stage, but commercial panels need accurate sun angle data to ensure that they follow the optimal tracking path throughout the day. Also, the effects of rain, snow, and wind can conspire to adversely affect alignment both instantly and over time. Planning for maintenance events using weather forecast data and estimating the effects of future events based on similar historical conditions helps to ensure the efficient operation of the system over time.

Lifecycle Analytics
Aside from day-to-day operational analysis, a well-run solar energy installation needs strategic analytics over longer periods to better understand and optimize its output. Weather data plays a key role in this analysis. Near-term weather forecasts, especially when compared to similar weather conditions in the past, can pinpoint seasonal demand fluctuation. Maintenance windows can be synchronized to occur before high demand and during low-demand periods to ensure maximum output during period of maximum need. Also, output and maintenance needs over time can be correlated to historical weather events such as storms and heat waves.
Long-term planning includes equipment upgrades and expansion considerations. Without proactive upgrades, photovoltaic output degrades over time. Weather measures such as historical cloud cover and air pollution can help you characterize changes to output power over time. Also, if you are considering an expansion either at the same site or nearby, comparing expected weather conditions over time at multiple locations will help you make the best decisions and obtain maximum energy production for every investment dollar.
Key weather api features
Full DocsHistorical and forecast data
Historical reports from ground-base stations & satellites and forecasts from global & local computer models
CSV and JSON Results
Obtain rich JSON structures or easy-to-use CSV from any API call
Location address geocoding
Look up solar data and weather details for any location using an address, ZIP Code, latitude/longitude & more
Weather API or direct download
Query data using our RESTful API or download data via our web-based Query Builder
Start today for free
Sign up for a free account now and immediately begin using our weather API to query accurate forecast & historical data for any global location.
In order to get access to our advanced solar energy measures, please sign up for a free account and then request a trial of the advanced solar elements.