

Many fruit plants and trees do not produce an optimal crop unless they experience a dormant period with lower temperatures. These dormant periods help the plant rest during the winter period. They also may regulate the plant’s development including the budding time.
Unlike a plant hardiness zone, which indicate the coldest temperatures that a plant is able to survive, chill hours are a measurement of how many cool temperature hours are required for a plant to produce the optimal crop.
For commercial growers, where the size of the fruit yield is very important for financial reasons, choosing the correct fruit plant that matches optimal chill hours to the typical expected conditions is extremely important. For gardeners, yield is less important but choosing a tree that conforms to the expected chill hours may still produce a more satisfactory plant.
How to measure chill hours
Chill hours (sometimes called chilling hours) are the count of the number of hours below a certain threshold temperature that occurs during the winter period. This threshold temperature is often counted as 45F (approximately 7.2C). In some cases, the threshold is combined with a second, lower temperature such as 32F (0C) so that chilling hours are only calculated for hours where the temperature observed was between 32 and 45F (0-7.2C).
Using chill hours
As it generally isn’t possible to change the local temperature or move a plant that has been planted, historical average chill hours can be used to help choose the best variety of fruit plant for a particular location. Some crops require higher chill hours than others. For example, certain apple tree varieties require more than 500 chill hours (and most require at least some chill hours and would be unsuitable for growing in warmer climates that don’t experience low temperatures).
Using hourly weather data to calculate historical chill hours
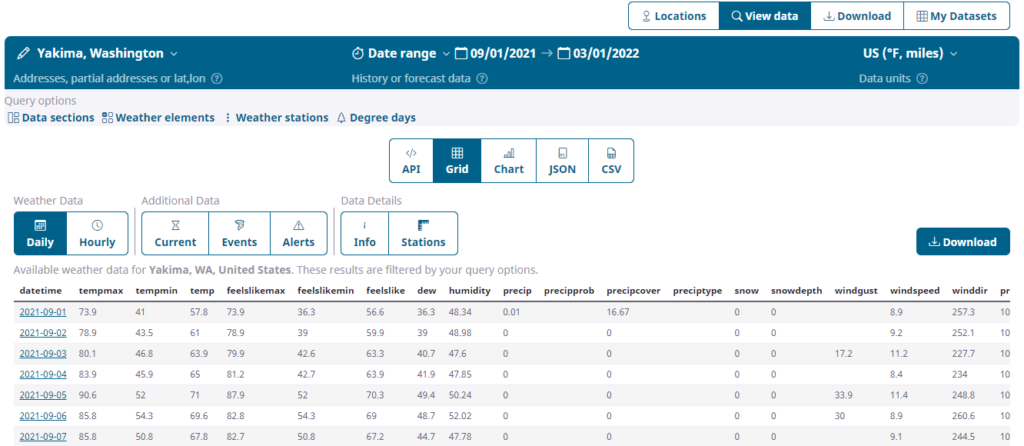
To calculate chill hours, we first need a reliable source of hourly historical weather data for the location of interest. For this we can use the Weather Data Query Page. This provides hourly weather history and weather forecast data in a variety of formats include CSV, Microsoft Excel and as a weather API if we want to integrate the data into an application.
In this example, we are going to use the page to download the hourly temperature for Yakima, Washington, USA for the fall and winter from September 1st to March 1st.
If this is your first time building a dataset using the Visual Crossing Query Builder you can use the following article as guide.
How to Build a Weather Dataset for Download, Bulk Import or Scheduling – Visual Crossing Weather
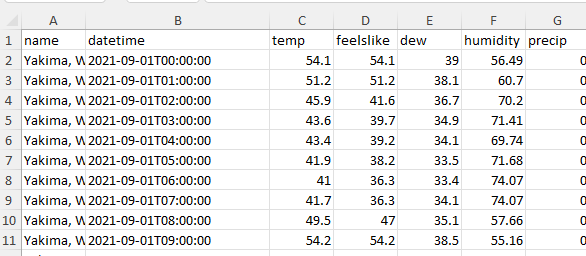
We then download the data as an Excel file so we can calculate the chill hours directly in Excel. Other applications could be used to create the calculation such as Google Sheets, databases or other data tools.
In our Excel workbook, we have many columns of weather elements. To calculate chill hours we will use the hourly temperature column, ‘temp’.
To calculate the chill hours, we will count all the hours that were between 32 and 45F using an Excel formula:
=COUNTIF(‘Weather Data’!C:C,”<45″)-COUNTIF(‘Weather Data’!C:C,”<32″)
In this case we count all the hours less than 45F and then subtract from that number all the hours below 32F. If you wanted to include hours below 32F you could simple use the formula:
=COUNTIF(‘Weather Data’!C:C,”<45″)
This gives us the number of chill hours that have occurred in Yakima, Washington as 1,358 hours.
As you can see, calculating chill hours is very straight forward. If you wanted to calculate the typical chill hours for a location, we could simply extend the above weather data to pull all the hourly data for the past ten years and calculate the number of chill hours per year.