

The MATLAB language built into the MATLAB numeric computing environment is a powerful tool that powers all type of data science and numerical analysis across many different fields. So, it is natural that MATLAB developers would want to load weather data for use in their calculations. Luckily, MATLAB has built-in functions make it extremely easy to execute web queries and also to parse JSON results into a structure array that can be used directly within MATLAB code. In this article we will show you how to load and use weather data within your own MATLAB code and analyses.
This guide assumes that you already have a Visual Crossing Weather account. If you don’t already have one, however, it is free and easy to sign up. Simply provide your email address, obtain your API key, and you will be ready to follow the steps below to load weather data into MATLAB.
Building a weather query URL
The first step in loading weather data into your MATLAB analysis is to create a weather query URL. You can do this in various ways including by using our web-based query page. Simply define your weather query in the interface, and the interface will generate the query URL for you automatically. Alternately, the weather query can be constructed either manually or in your MATLAB code by following the guidelines in the Weather API documentation.
One of the easiest weather queries and the one that we will use in the remainder of this guide is a simple Timeline Weather query for the 15-day forecast. In the URL for this query, we only need to specify the forecast’s target location. The weather engine will infer that we want to query the forecast for that location. That query URL takes this form:
https://weather.visualcrossing.com/VisualCrossingWebServices/rest/services/timeline/<LOCATION>?key=<YOUR_API_KEY>
Simply replace the <LOCATION> placeholder with your desired target location, for example, Paris, France and <YOUR_API_KEY> with the API Key for your account. If my API Key is 1234567890, I could use the follow query to obtain the 15-day forecast for Paris.
https://weather.visualcrossing.com/VisualCrossingWebServices/rest/services/timeline/Paris?key=1234567890
Of course, this query is the most basic weather query example. It would be easy to make it more sophisticated by changing it to query any worldwide location for any date, past, present, or future. You can learn more about the Timeline Weather API and the available options and parameters in our documentation. It is good to get familiar with the API options because you will often want to build query URLs in your MATLAB code instead of running hard-coded URLs. Using the documentation will allow you to assemble the URL parameters easily to create all types of custom and dynamic queries.
One key benefit of a URL API is that you can test the query URL in any browser and instantly see the JSON result. The Paris query example above will produce a result that looks like this.
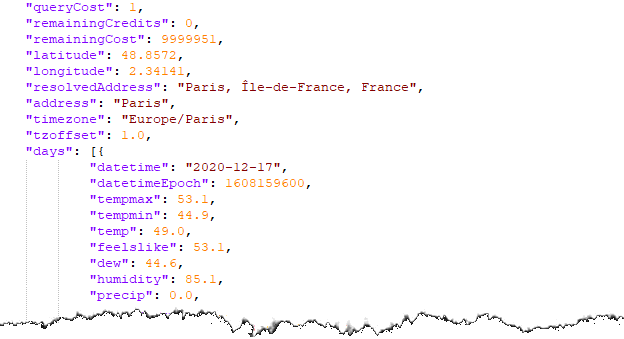
Executing a query URL in MATLAB
Once you have a weather query URL either created manually, via the weather query page, or constructed in your own MATLAB code, you are ready to run this query. As a high-level language MATLAB makes it very easy to query data from a URL, and it can be accomplished with only a few lines of code. In this example, we will use the entire query URL as a single, static string. However, more sophisticated code would use MATLAB code to adjust the parameter on the URL to vary the location and date range as needed by the analysis.
We can then use MATLAB’s webread() function to send the query URL to the weather server and retrieve the response data in a single call. MATLAB will automatically handle all of the network communications with the weather server. In addition, MATLAB will automatically detect that the result is JSON and parse that JSON to return those results as a structure ready to use in our code.
Here is an example code snippet that shows the necessary steps.
url = 'https://weather.visualcrossing.com/VisualCrossingWebServices/rest/services/timeline/Paris?key=<YOUR_API_KEY>';

weather = webread(url);
Using the JSON weather results in MATLAB
Since MATLAB cleverly parses the JSON results for us, we now have the weather data available to us a structure. Unlike most languages, there is no additional decoding or parsing work for us to do. We are ready to work with it in our MATLAB project immediately.
To show how to use the weather data in MATLAB, we will end this example by making a simple plot of the expected temperatures in our forecast. Given the power of MATLAB, it is easy to do this using just a few lines of code. Since the JSON has automatically been parsed into a structure, we can pull out the details that we need for our plot as arrays. We can then use these arrays to drive the plot command. In the code below, we’ll continue the example where we left off above. In the first two lines we’ll use the weather data in the structure to build two arrays. The first array will use the datetimeEpoch values from the JSON to hold the dates for each forecast record. We will use the MATLAB datetime() ‘convertfrom’ function to convert the epoch time values into a human-readable format. The second array will hold the temperatures.
The plot() function can then take these two arrays as input to generate a plot of the temperatures from our 15-day forecast query. To improve the appearance and usefulness of our plot, we’ll add the weather description as the title as well as hard-coded a legend. The code looks like this.
dates = datetime([weather.days.datetimeEpoch], 'convertfrom', 'posixtime', 'Format', 'MM/dd/yy');
temps = [weather.days.temp];

plot(dates, temps);
legend("Forecast Temperature");
title(weather.description);
And the plot itself looks like this.
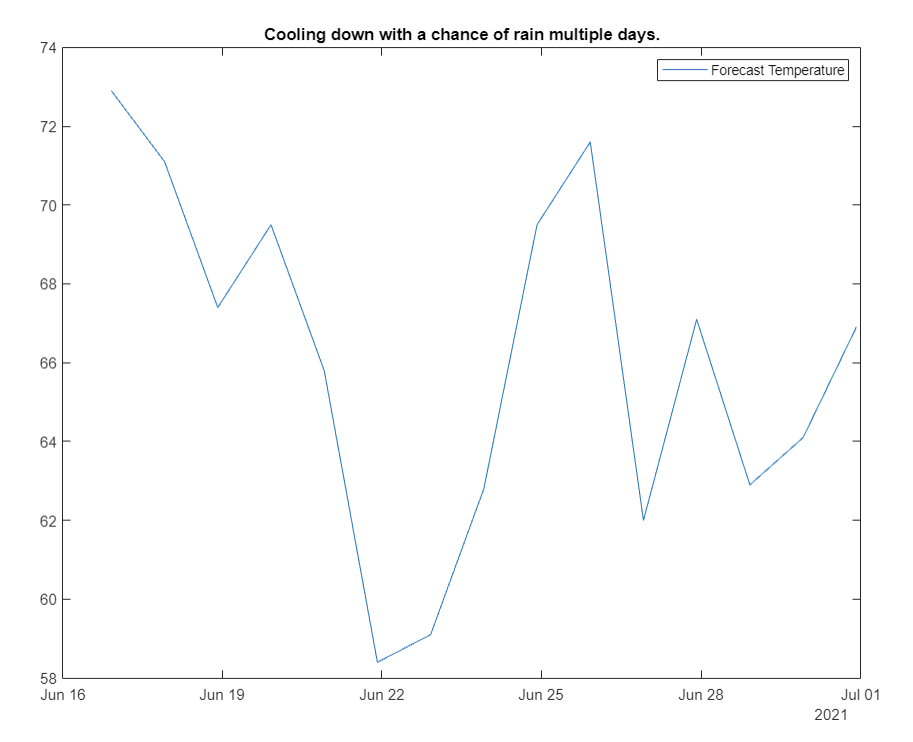
Of course, this is just the most simple use of weather data . We could expand our plot by adding the maximum and minimum temperatures as well as other weather measures. We could continue by adding in other data to expand our analysis such as business measures or other statistics from external sources. Once we have the weather data loaded into MATLAB, its use is limited only by the power of MATLAB analysis itself.
Summary
In this article you have seen how easy it is to create a weather query using Visual Crossing Weather and then run that query inside MATLAB. MATLAB makes the process easy, and the entire task can be accomplished with just a few lines of code. Once you have the weather results loaded, you are ready to use the data in your own weather data analyses. Since MATLAB is a premier environment for complex data analysis, your next step might be to find patterns within weather data over time or make an analysis comparing business results data to weather measures to find correlations.
Of course, the forecast query example in this article shows only the most basic example of how to use the Visual Crossing Weather API in MATLAB. However, even from this simple query, you can read many different weather forecast measures including current conditions. The Timeline Weather API also supports historical queries that can return weather reports from any global location for any time and date since 1970. Beyond that, our statistic (climate-based) forecasts allow you to see weather norms for any date of the entire year. When using MATLAB, you will be able to put this functionality and much more to work when you weather-enable all of your analyses.
Questions or need help?
If you have a question or need help, please post on our actively monitored forum for the fastest replies. You can also contact our Support Team.