

In this article, I’m going to show you how to download weather forecast for any worldwide location data as a standard Microsoft Excel file.
Quick Steps to Get Started Now
- Sign up for a free Visual Crossing Weather account here: https://dev.visualcrossing.com/weather-query-builder/
- Enter the location(s) for your analysis and select the date or date range that interests you.
- Use our web-based Query Builder to view the data and optionally explore the available weather data in your browser.
- Click the Download button to bring up the export wizard and select Excel as your download format.
- The Weather Engine will run your query and allow you to download an Excel file containing your results.
- Open the downloaded file in Excel or any other tool that can read Excel data.
If these steps are too terse for you to follow, don’t worry. We will walk you through them step by step in the article below. So, keep reading.
The estimated time to complete this exercise is less than 5 minutes.
Step 1 – Open the Weather Data Query Page
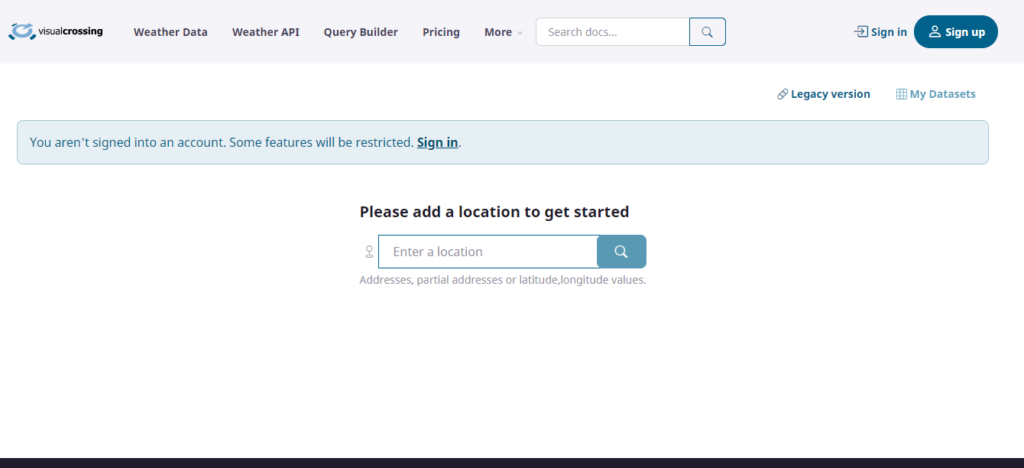
We’ll start by going to the Visual Crossing Weather Data Services page. It is from here that you can sign up for a free account as well as execute any weather query using our web-based Query Builder interface. If you would like to read more the various types of weather data that we offer first, head over to our weather data page.
Step 2 – create a free weather data account and sign in
Once there, you can sign into your free Visual Crossing Weather account. If you don’t already have an account, you can click on the button in the upper-right of the page to create an account. Signing up for a free account will give you immediate access to a full 15-day weather forecast for any global location. (Note that you can use the same account to query historical weather data for Excel as well.)
For step-by-step details on signing up, please see our detailed article.
If you intend to complete this tutorial and download the data you will need an account. However, if you would like to simply view a preview of the data in a browser, an account is not required.
Step 3 – enter a location address for weather data
For this example, we’ll select the option to manually enter a location address to use for the weather forecast.
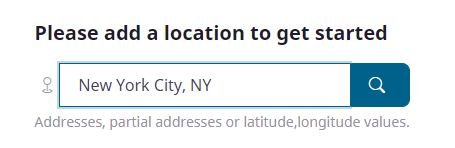
For the location, we can enter any address, a city name, a postal code, or even a latitude and longitude pair. If you enter a city name, also include the state and country if possible as there are many locations with the same town or city name!
Optionally, we can also give the location a friendly name for our own reference in the output data. This feature can be useful when you are comparing multiple locations in the same dataset. Entering the location name is available once you have previewed your first dataset.
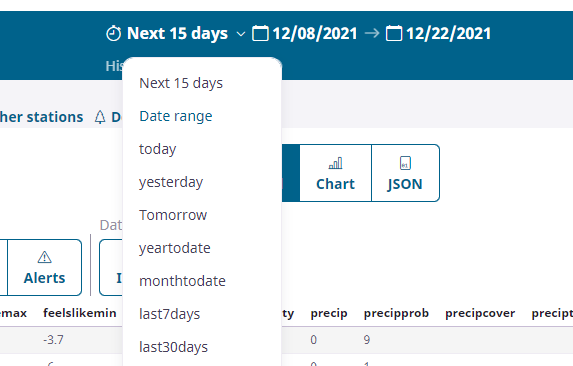
Step 4 – choose the weather data time range
As soon as we enter the location information, the 15-day weather forecast is shown on the grid. However, in this panel there are other options as well including weather history queries, and hourly data. These are among the many options covered by our other tutorials and videos. Please take a look at those or reach out to us if you need more information on these options.
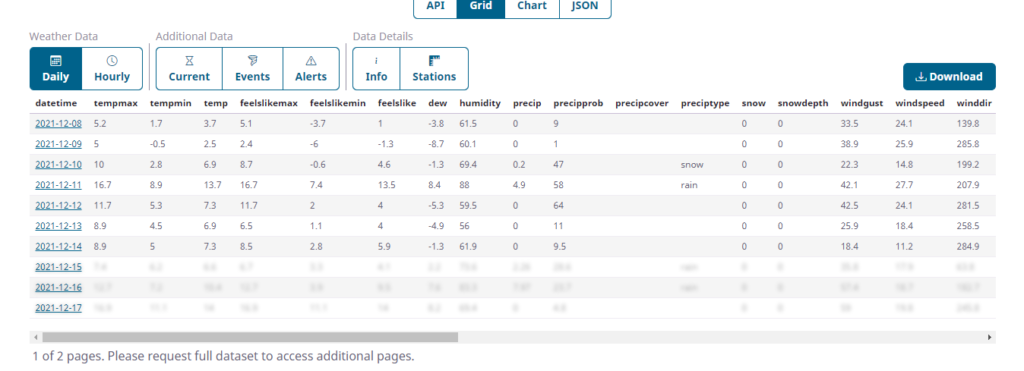
Step 5 – viewing the weather data in the Query Builder grid
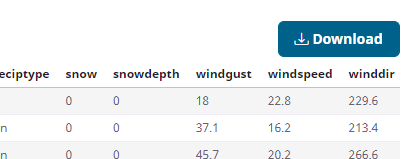
The grid displays the full weather data in an easy-to-read table format. Data available includes the temperature, feels like (heat index and wind chill), precipitation, wind and many more weather elements. If you want to reduce the number of columns, you can use the ‘Weather elements’ link in the toolbar to make a custom selection.
Step 6 – View the full weather forecast graphically
In addition to the default daily data, various additional data views are available. These include grids showing the hourly data. Also, for weather forecast queries, additional tables may be populated including any active weather alerts for the selected location.
There is also a chart view which summarizes some of the weather elements at the daily or hourly view. This provides a quick and easy way to understand the data,
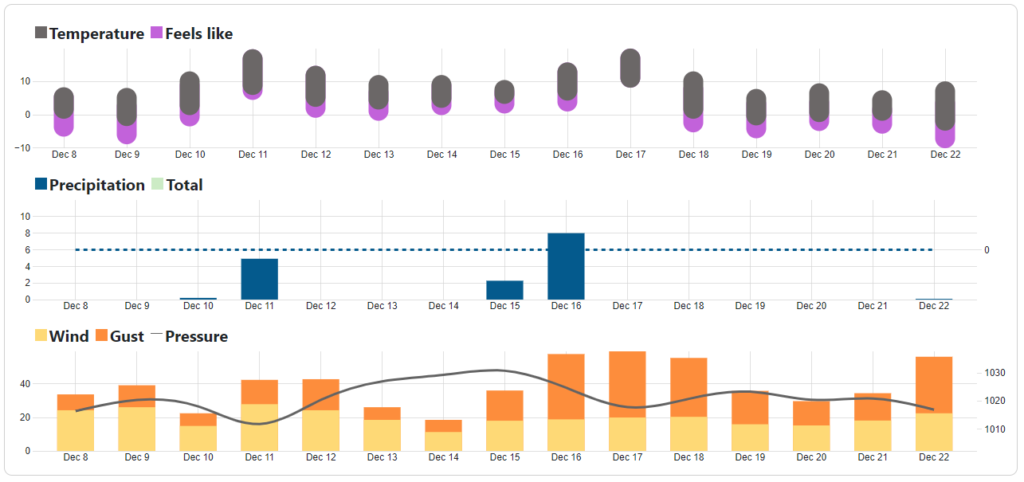
You can see the various weather metrics that are provided in the output data. These metrics include common values such as temperature, precipitation, and wind as well as less common value such as heat index, cloud cover, and wind gusts. For more information on the details and how to use these various weather metrics in your own analyses, please see our weather data documentation.
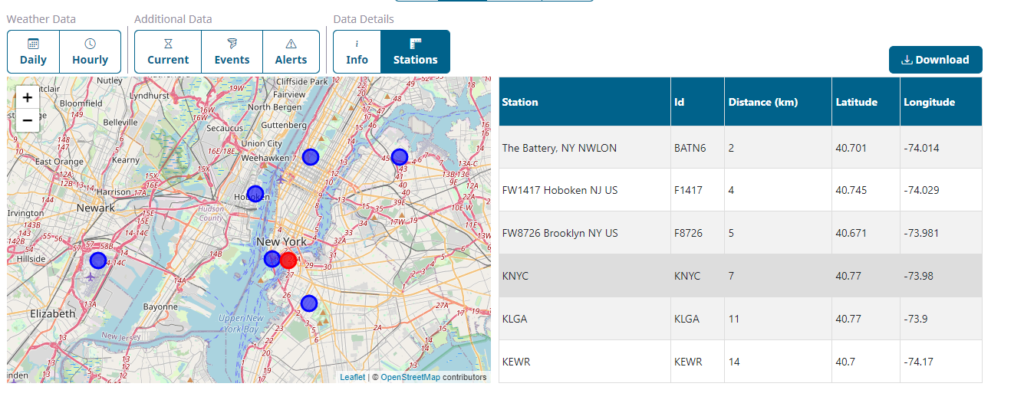
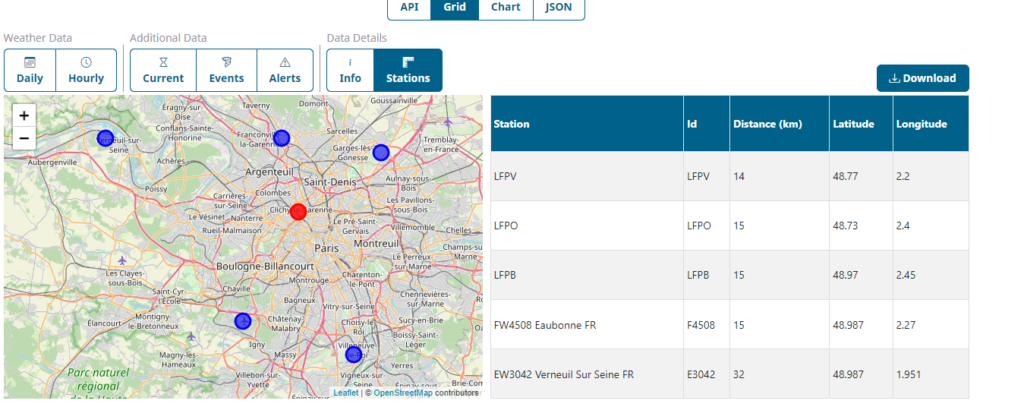
The ‘Stations’ view provides a map of the selected location and the surrounding weather stations. Note that observations from these stations are used to build historical weather reports. However, weather forecast data is based on various atmospheric models run by super computers. This process produces our model based forecast.
We can now download the data as a Microsoft Excel workbook by pressing the “Download” button. If you only need data for a single location, you can skip the next step and start with step 8. However, in many cases you may have the need for forecast data for more than one location. If this is your case, we will show you how to add an additional location in the next step below. You can see that working with multiple locations is as easy as working with one.
Step 7 – add a second location (optional)
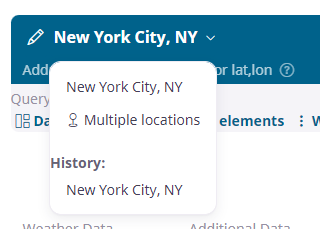
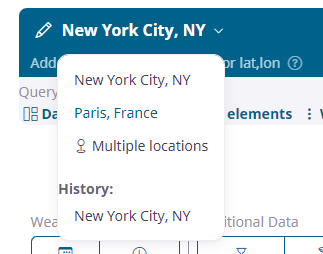
To add a second location, we need to click on the Locations dropdown at the top of the window and then click on ‘Multiple locations’ top create a list of locations.
The multiple location link brings up the location list editor. In it we can add any location that interests us, including international locations such as Paris France.
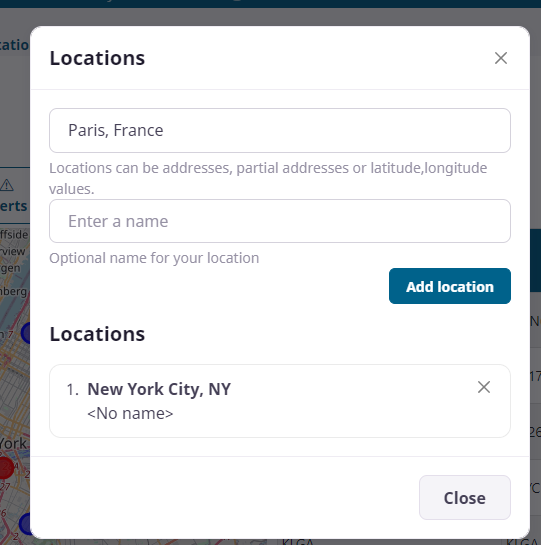
Simply add each location you need. Once you have finished, you can click ‘Close’
In the query page, we can now switch between outr locations using the locations drop down:
As soon as we click on Paris, France, the query is updated and each view now shows the 15-day forecast for Paris. In the Query Builder interface, the data table and map are automatically updated based on our location seletion.
Step 8 – Download the weather data as a Microsoft Excel Workbook
To download the weather data into Microsoft Excel, we can use the Download button:
This button brings up the Download data popup which presents a series of options to export the data to various formats such as CSV (comma separated values), Excel, and JSON.
In this case we are going to select Excel to automatically create a workbook.
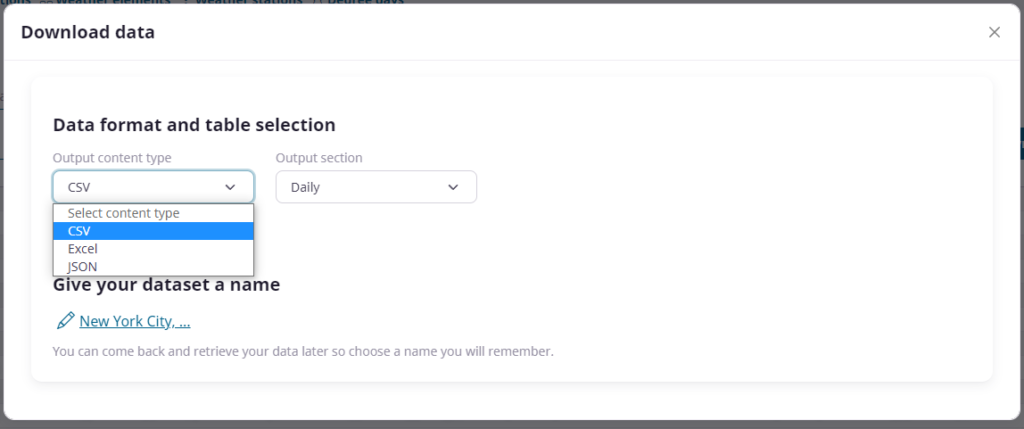
We then choose which type of data we would like to export to Excel. These options mirror the options that we saw on the grid view of the query view.
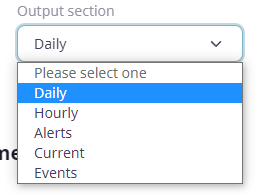
In this example, we are going to use the daily data. If we want, we can rename the download dataset definition. This will save the query definition in your account and is useful if you plan to return and run the same dataset again.
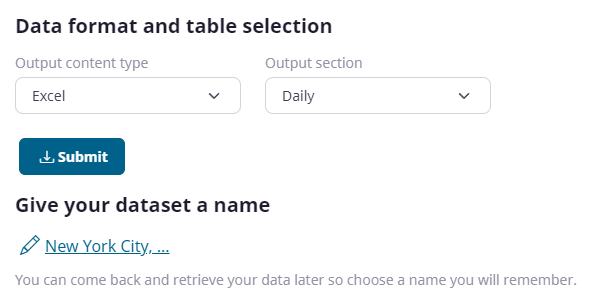
Pressing ‘Submit’ will submit the download. Query Builder will then create the Excel datasets and offer them for download.
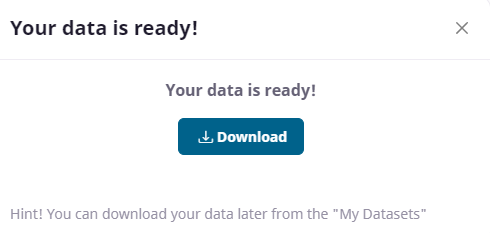
You can also use the ‘My datasets’ link in the top right of the page to retrieve the data at a later date. This is useful if you don’t want to download the dataset at the moment or if you want to down load it again.
When you click download, the Excel data will be retrieved to your local computer. If you have submitted multiple locations, Query Builder will create a Zip file for you containing individual Excel files, one for each location.
Finding out more about Visual Crossing Weather data
If you would like to learn more about using Visual Crossing Weather options such as history data, multiple location import, and use within other analysis tools please see our other tutorials.
We also offer a Weather API that can be used to retrieve data into Excel using the PowerQuery scripting language.
Questions or need help?
If you have a question or need help, please post on our actively monitored forum for the fastest replies. You can also contact our Support Team.